Press release 09/07/2025
HIGH TECHNOLOGY SECTOR STATISTICS 2023
The high technology manufacturing industry gained weight in the sector as a whole and accounted for 12.8% of gross value added in the Basque Country in 2023
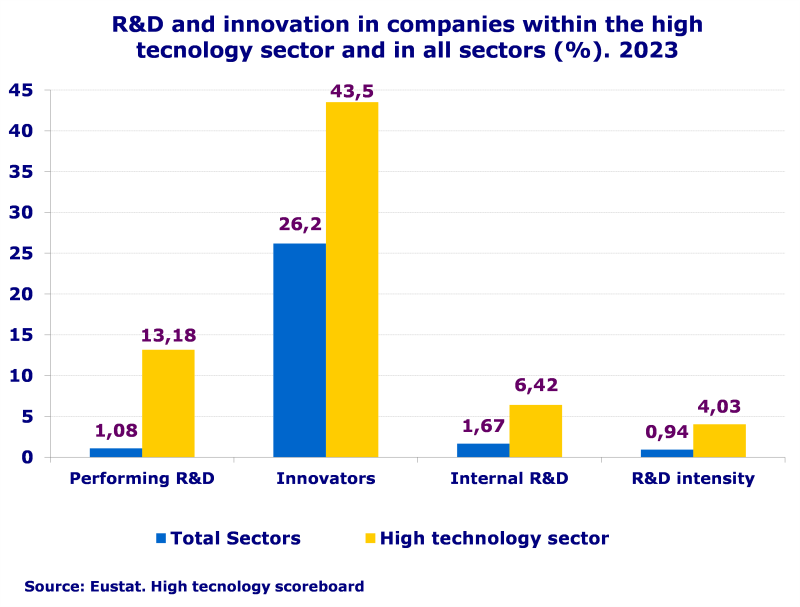
Higher innovation intensity (6.4%) and R&D intensity (4.0%) was recorded in the high technology sector than in all the sectors as a whole (1.7% and 0.9%, respectively)
The high technology manufacturing industry accounted for 12.8% of the gross value added (GVA) of the high technology sector (HTS) as a whole in the Basque Country in 2023, following growth of three percentage points compared to 2013, according to Eustat data. The high technology sector, which covers all activities with a sound technological base and a fast renewal of knowledge, is comprised of the high technology manufacturing industry sector, the medium-high technology manufacturing sector and the high technology or cutting-edge technology services sector.
Although the high technology manufacturing industry experienced the highest relative growth, the medium-high technology manufacturing industry, with 58% of GVA, continued to predominate, despite its weight dropping by almost half a point. Meanwhile, high technology or cutting-edge technology services accounted for 29.2% of the total, despite a decrease of 2.6 points compared to 10 years earlier.
Furthermore, the ratios of innovation expenditure (innovation intensity) and R&D expenditure (R&D intensity) to turnover were higher in the HTS sector than in all the sectors as a whole. Specifically, innovation intensity in this sector was 6.42% compared to 1.67% for all economic sectors as a whole. In the case of internal R&D, the ratio was 4.03% for the sector and 0.94% for all the economic sectors.
Main magnitudes from the high technology sector in the Basque Country . 2013-2023
| | Number of companies | Jobs | Turnover (1) | Gross value added at factor cost (1) |
| 2023 | 5.105 | 101.851 | 27.230.220 | 8.193.741 |
| 2022 | 5.032 | 98.653 | 24.979.314 | 7.258.862 |
| 2021 | 5.033 | 95.412 | 21.812.167 | 6.727.658 |
| 2020 | 4.946 | 93.732 | 19.836.024 | 6.391.263 |
| 2019 | 4.927 | 94.777 | 22.430.228 | 7.010.523 |
| 2018 | 4.881 | 93.458 | 21.336.764 | 6.777.987 |
| 2017 | 4.789 | 89.710 | 20.306.692 | 6.516.869 |
| 2016 | 4.852 | 87.727 | 19.198.452 | 6.251.960 |
| 2015 | 4.787 | 85.100 | 17.696.422 | 5.989.997 |
| 2014 | 4.745 | 84.419 | 16.872.644 | 5.746.375 |
| 2013 | 4.718 | 86.571 | 17.085.535 | 5.806.417 |
(1)Thousand euros
Date July 9, 2025
Source: Eustat. High tecnology scoreboard
The high technology sector as a whole saw its GVA increase by 41.1% in current terms, rising from 5,800 million to 8,200 million euros between 2013 and 2023. The manufacturing industry, which comprises both the high and medium-high technology manufacturing industries, led this growth, with a variation of 46.4% between 2013 and 2023. Of particular note within the manufacturing industry was the high technology manufacturing industry, which practically doubled its GVA (83.9%), causing its weight in the HTS sector as a whole to rise from 9.8% in 2013 to 12.8% in 2023. Meanwhile, the medium-high technology manufacturing industry saw an upturn of 40.1% High technology or cutting-edge technology services also recorded significant growth (29.8%).
Despite its positive performance, the contribution of the HTS sector as a whole to the total GVA of the economy remained stable, ranging from 9.7% in 2013 to 9.8% in 2023.
Over the last 10 years, the total number of companies in the sector saw an increase of 8.2%, rising from 4,718 to 5,105. However, the high and medium-high technology manufacturing industry posted a decrease of 14.5%. Within industry, the medium-high technology manufacturing industry was the worst affected, with a drop of 17.2% in the number of companies, as the number of high technology manufacturing companies was up 11.8%. High technology services also performed positively (20.9%). In relative terms, the HTS sector as a whole increased its contribution to the economic total: it went from accounting for 2.9% of all companies in 2013 to 3.5% in 2023.
Meanwhile, the number of jobs in the sector as a whole grew by 17.7%, rising from 86,571 to 101,851 over the period analysed. Both high technology services and the high and medium-high technology manufacturing industry recorded significant growth, albeit it to varying degrees, with a cumulative increase of 27.7% in the former case and 13.3% in the latter.
In the case of the manufacturing industry, once again, the most marked performance was seen in the high technology manufacturing industry (29.7%), exceeding the growth in employment registered in the medium-high technology manufacturing industry, which stood at 10.5%.
The contribution of the high technology sector as a whole to total employment in the economy also increased, albeit more moderately, from 8.7% to 8.9%.
The overall trend in the number of companies and jobs meant that between 2013 and 2023, the average company size increased from 18.3 to 20 employees. This growth was especially noteworthy in the manufacturing sector, where the average rose from 35.7 to 47.3 employees (+32.5%). The high technology services sector maintained its more atomised structure with an average size that saw hardly any change, rising from 8.6 employees per company to 9.1 over the same period (+5.6%).
During the period, turnover in the HTS sector grew by 59.4%, going from 17,100 million to 27,200 million euros in current prices. This increase was primarily driven by the performance of the manufacturing industry, which accounted for 84.7% of the total, having grown by 62.1% over the last decade. Within the manufacturing industry, the high technology and medium-high technology sub-sectors performed similarly, with increases of 59.1% and 62.5%, respectively. High technology services (15.3% of the total) also followed an upward trend, with growth of 45.9% in respect of 2013.
Compared to the previous tax year, all the figures for the high technology sector as a whole improved. The number of companies increased by 1.5%, the number of jobs by 3.2%, turnover by 9.0% and value added by 12.9%.
Main magnitudes from the high technology sector in the Basque Country by province and economic activity (thousands of euros). 2023
| | Enterprises (1) | Turnover | Gross value added cf | Jobs |
| High and medium-high-tech sector | 5.105 | 27.230.220 | 8.193.741 | 101.851 |
| Province | | | | |
| Araba / Álava | 730 | 8.105.815 | 1.384.177 | 17.059 |
| Bizkaia | 2.708 | 8.779.763 | 3.393.297 | 41.113 |
| Gipuzkoa | 1.818 | 10.344.642 | 3.416.267 | 43.679 |
| | | | | |
| High- and medium-high-tech manufacturing industry | 1.449 | 23.060.500 | 5.801.073 | 68.499 |
| High technology | 180 | 3.025.246 | 1.048.728 | 11.606 |
| Medium-high technology | 1.269 | 20.035.254 | 4.752.345 | 56.893 |
| High-tech or state-of-the-art services | 3.656 | 4.169.720 | 2.392.668 | 33.352 |
(1)The territorial sum of the number of companies may not match the total
They have been counted once in each historical territory in which they have activity and only once in the total of the C.A. from Euskadi
Date July 9, 2025
Source: Eustat. High tecnology scoreboard
The high technology sector was responsible for 74.9% of expenditure on internal R&D in the commercial sector and 57.8% of this expenditure in all the sectors as a whole
13.2% of companies in the high technology sector carried out R&D activities, a percentage that is far higher than the total for all sectors (1.1%). Furthermore, this sector accounted for 44.2% of those undertaking R&D in the commercial sector and, with 1,158.2 million euros, was responsible for 74.9% of expenditure on internal R&D in the commercial sector, or 57.8% of this expenditure in all the sectors as a whole.
With regard to people working in R&D in the HTS sector, it should be pointed out that in 2023 there were 11,748 people employed in full-time equivalent jobs (FTE), 71.4% of the personnel dedicated to R&D in the commercial sector, or 50.4% if the comparison is made with personnel dedicated to these activities across all sectors. There were 3,911 women, representing 33.3%. Of the total number of personnel in full time equivalent jobs, 7,828 belonged to the category of researchers; 2,613 (33.4%) were women.
Establishments and F.T.E. staff dedicated to R&D within the high technology sector in the Basque Country by province and economic activity according to occupation and sex. 2023


| |
Number or establishments |
FTE personnel |
Researchers FTE |
| |
|
Total |
Women |
Women % |
Total |
Women |
Women % |
| TOTAL R&D |
1,594 |
23,299.7 |
8,687.7 |
37.3 |
16,304.9 |
5,878.5 |
36.1 |
| Business Sector R+D |
1,522 |
16,452.4 |
5,116.1 |
31.1 |
11,061.0 |
3,435.9 |
31.1 |
| High and medium-high-tech sector I+D |
673 |
11,748.0 |
3,910.6 |
33.3 |
7,827.8 |
2,613.1 |
33.4 |
| Province |
|
|
|
|
|
|
|
| Araba / Álava |
96 |
1,160.8 |
387.2 |
33.4 |
776.3 |
247.9 |
31.9 |
| Bizkaia |
274 |
4,417.4 |
1,525.1 |
34.5 |
3,095.0 |
1,024.5 |
33.1 |
| Gipuzkoa |
303 |
6,169.9 |
1,998.2 |
32.4 |
3,956.5 |
1,340.7 |
33.9 |
| |
| High- and medium-high-tech manufacturing industry R+D |
311 |
4,379.5 |
1,095.5 |
25.0 |
2,362.6 |
602.2 |
25.5 |
| High technology |
65 |
1,377.4 |
380.4 |
27.6 |
839.4 |
211.4 |
25.2 |
| Medium-high technology |
246 |
3,002.1 |
715.1 |
23.8 |
1,523.2 |
390.8 |
25.7 |
| High-tech or state-of-the-art services I+D |
362 |
7,368.5 |
2,815.1 |
38.2 |
5,465.2 |
2,011.0 |
36.8 |
E.D.P.: Equivalent to full time
Date July 9, 2025
Source: Eustat. High tecnology scoreboard
Regarding innovation, as with R&D, there were significant differences between the total for all sectors and for the high technology sector. In 2023, 43.5% of establishments in this sector were innovators compared to 26.2% of the total for all sectors. For establishments with 10 or more employees, these percentages reached 61.4% in the first case and 38.4% in the second.
High and medium-high technology establishments spent a total of 1,873 million euros on innovation activities in 2023, more than half of the total expenditure of all sectors, specifically 52.5%. Of this expenditure, 1,745 million corresponded to establishments with 10 or more employees, which was 55.6% of the total expenditure by companies of that size on this activity.
The high technology sector allocated more resources to R&D+i
Looking at the "innovation" and "internal R&D" intensity ratios, it is also clear that the high technology sector allocated a greater proportion of resources to R&D+i than the other sectors. Specifically, innovation intensity in this sector was 6.42% compared to 1.67% for all economic sectors as a whole. In the case of internal R&D, the ratio was 4.03% for the sector and 0.94% for all the economic sectors.
Internal innovation and R&D intensity from the high technology sector in the Basque Country by province and economic activity (%). 2023
| |
Total |
10 or more employees |
| |
Innovation Intensity (1) |
Internal R&D Intensity (2) |
Innovation Intensity (1) |
Internal R&D Intensity (2) |
| TOTAL SECTORS |
1.67 |
0.94 |
2.27 |
1.36 |
| High and medium-high tech sector |
6.42 |
4.03 |
6.42 |
4.17 |
| Province |
|
|
|
|
| Araba / Álava |
4.20 |
1.61 |
4.01 |
1.51 |
| Bizkaia |
7.82 |
4.47 |
7.83 |
4.67 |
| Gipuzkoa |
6.23 |
4.88 |
6.40 |
5.18 |
| |
| High- and medium-high-tech manufacturing industry |
3.47 |
1.73 |
3.52 |
1.81 |
| High technology |
5.93 |
2.59 |
6.02 |
2.62 |
| Medium-high technology |
2.92 |
1.54 |
2.95 |
1.62 |
| High-tech or state-of-the-art services |
18.43 |
13.37 |
19.85 |
15.07 |
(1)Innovation Intensity: (Spending on innovation/turnover)*100
(2)Internal R&D intensity: (Spending on internal R&D/turnover)*100
Date July 9, 2025
Source: Eustat. High tecnology scoreboard
Likewise, both the use of Information & Communications Technology (ICT) and e-commerce were more widespread among companies in this sector than in the total of all sectors. In 2023, 55.2% of establishments in this sector engaged in e-commerce, compared to 29.2% of those in all sectors as a whole.
These percentages were a result of the 52.1% of establishments in this sector that made electronic purchases, compared to 26.3% of establishments that did so across all sectors, and the 16.4% of establishments in the high technology sector that made electronic sales, a figure that stood at 8.8% in the case of all sectors.
However, the impact of this sector on the foreign trade of goods was not particularly significant. Whilst exports accounted for 1,226.7 million euros out of a total of 32,750.4 million, imports stood at 830.6 million out of the 26,944.2 million of total imports. These figures represented 3.7% and 3.1%, respectively, out of total exports and imports.
Standing out among the most common products traded in terms of exports were: "Machinery and Mechanical Equipment" (33.6%), "Manufacture of Aircraft and Spacecraft" (23.3%), "Arms and Ammunition" (16.0%) and "Electronic material, Radio, TV, and Communications Equipment" (13.3%). Of particular note in imports were "Electronic Material, Radio, TV and Communications Equipment" (29.2%), "Scientific Instruments" (20.0%) and "Manufacture of Aircraft and Spacecraft" (18.9%), with none of the remaining categories reaching 10%.
Methodological note:
The sectors that belong to the high technology sector are those that, given their degree of complexity, require an ongoing research effort and a sound technological base. The activities included in this sector, according to the CNAE 2009, are listed on the Eustat website. Methodology file: The high technology statistics sector
For further information:
Eustat - Euskal Estatistika Erakundea/Basque Statistics Institute
C/ Donostia-San Sebastián, 1 01010 Vitoria-Gasteiz